Below are key screenshot examples of dcTrack and Power IQ . (click to enlarge)
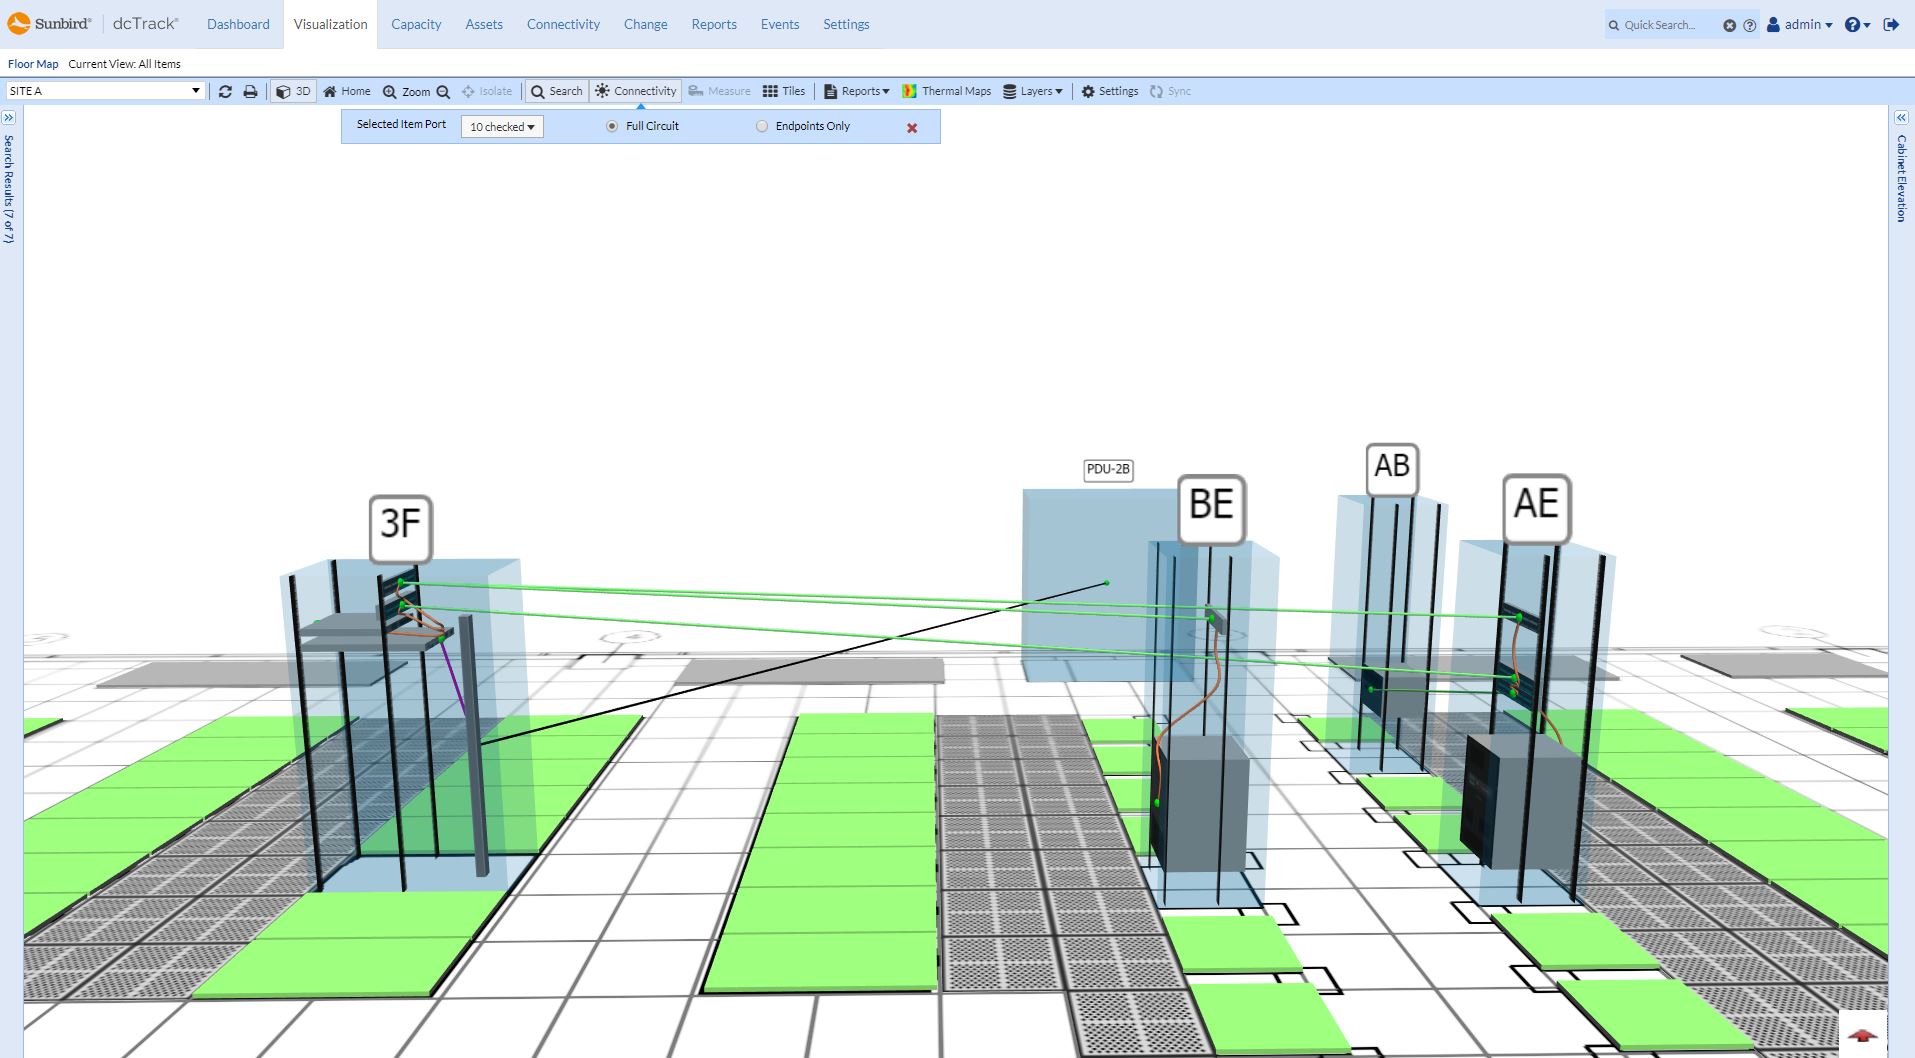
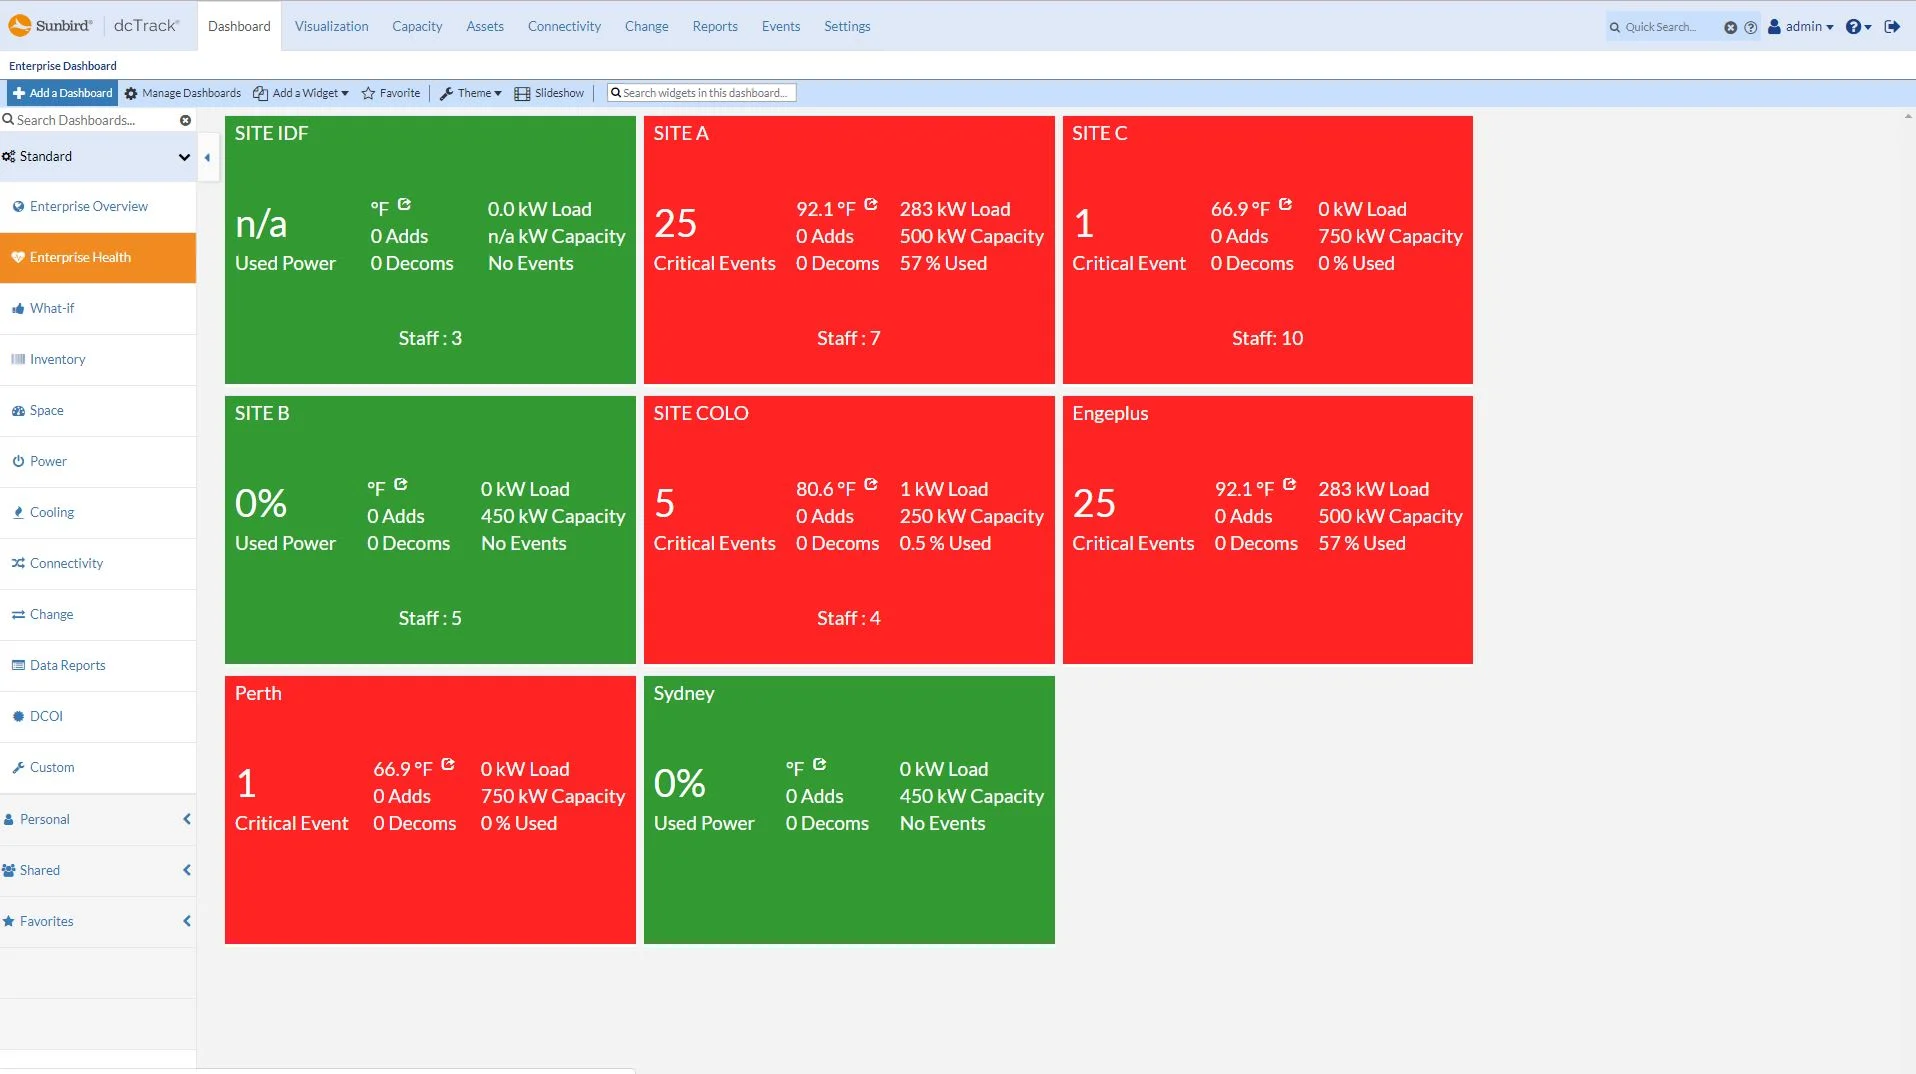
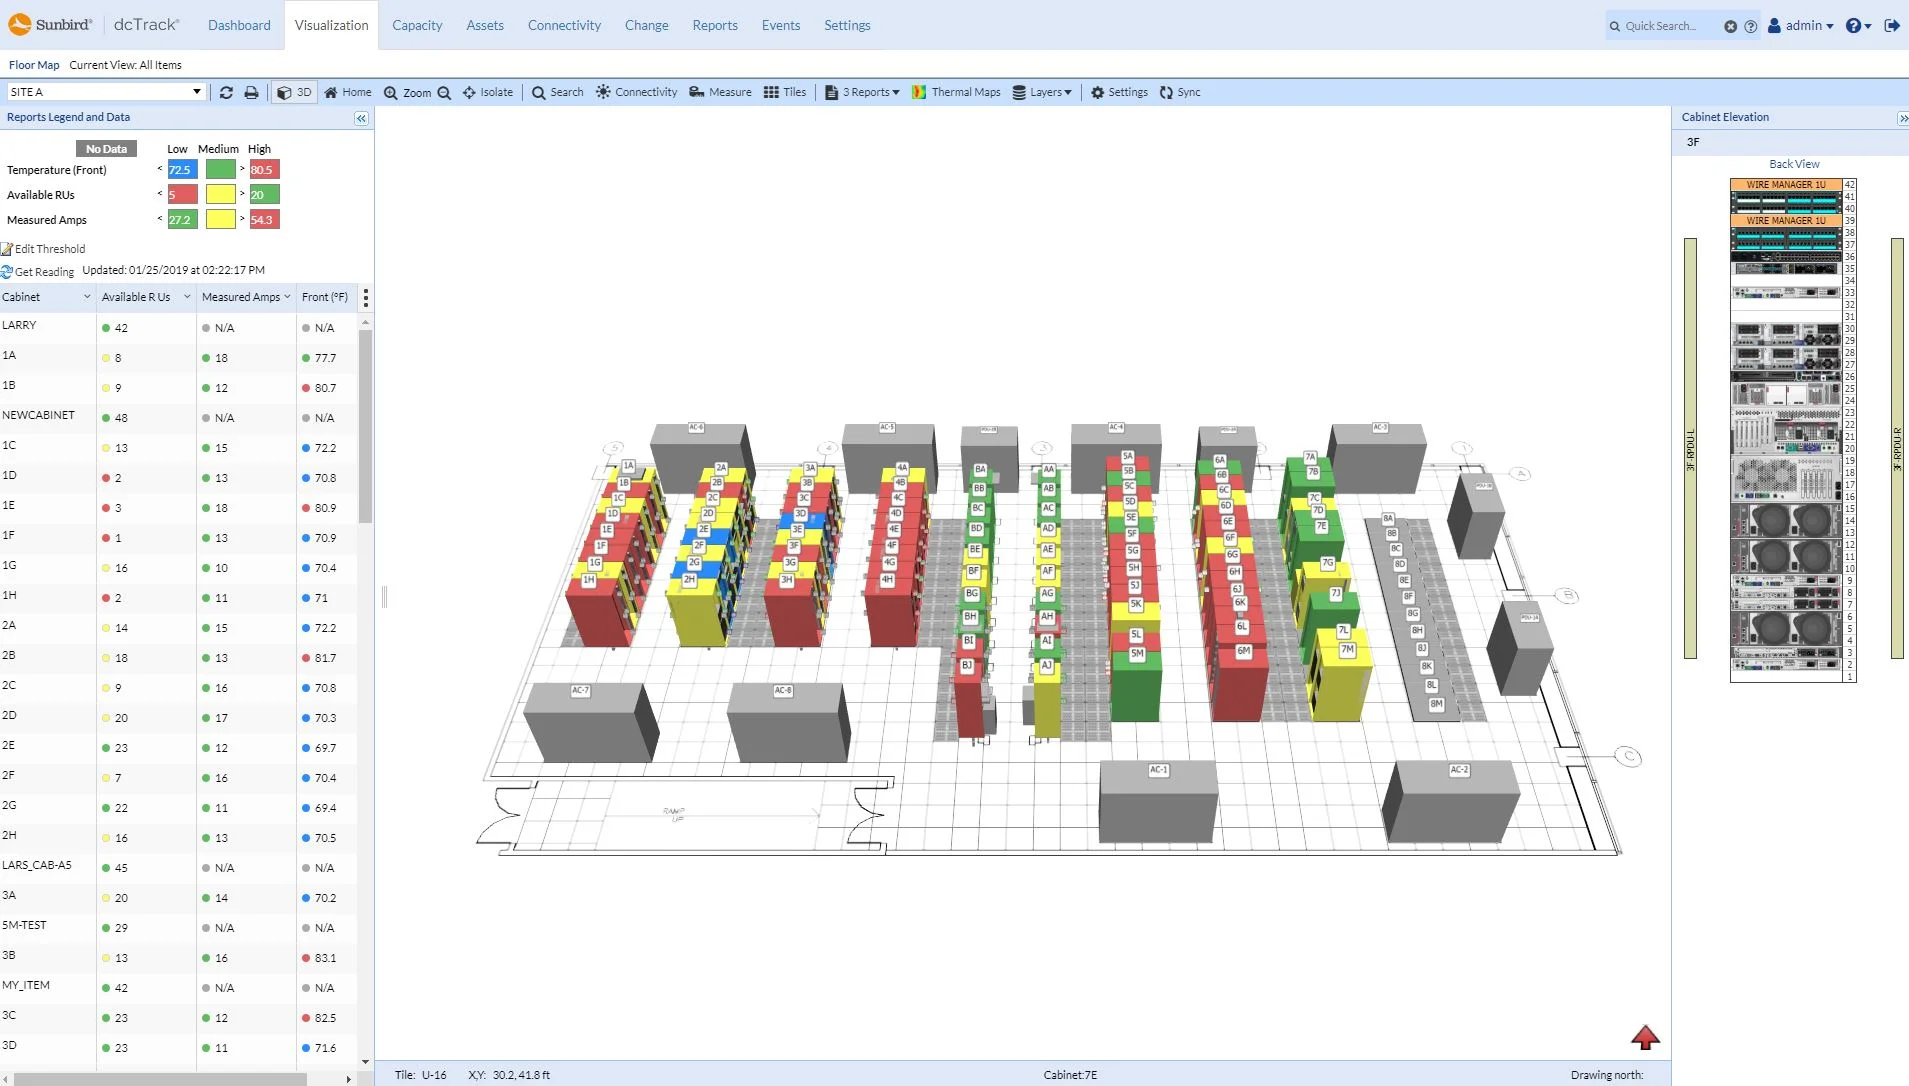
dcTrack
Featured
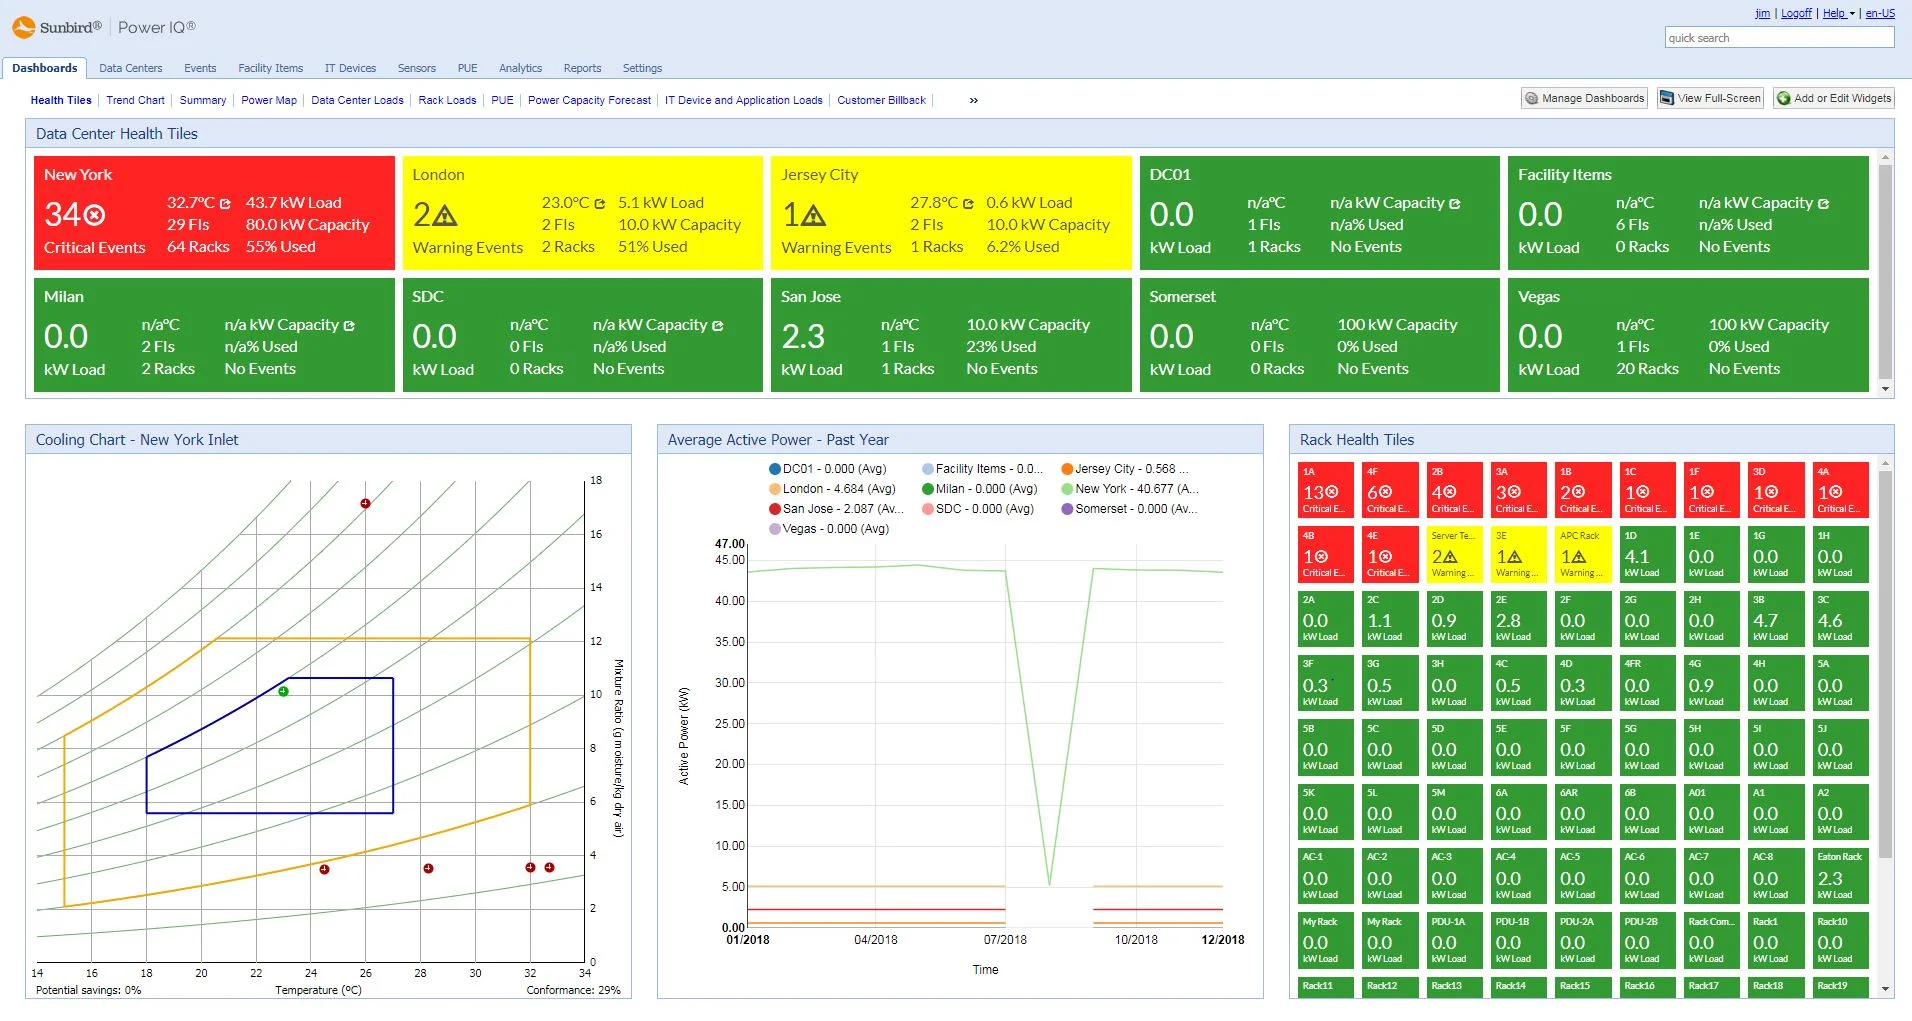
Power IQ
Featured